Tutorial 4 - Data Description Tutorial
Importing and Describing the Louisiana Mortality Files
In this tutorial, we’ll write code to import the Louisiana Mortality File (we already did this in Tutorial 3) and identify each of the variables included in the data. It’s important to know what each variable is measuring before we can create an analytic file for analysis.
Before beginning the tutorial, create a GitHub repo called hpam7660_Cancer_Alley. Then create a new RStudio project and link it to the new GitHub repo. Once you’ve done that, open a new Markdown document and give it a YAML header that includes the title “Louisiana Mortality Data Description”, your name, the date, and “pdf_document” as the output format.
Import the Louisiana Mortality File
Write some code that uses the read_csv command to load the LA Mortality File into RStudio and then create a list of each data element (variable name) in the file.
Describe the LA Mortality File Data Elements
Each year of the data has its own associated data documentation on the CDC site. We could go through the documentation file for each year, but it turns out that the data fields don’t change much from year to year. So, for our purposes, we can use the 2019 data documentation file to describe the data set. Open the documentation file for the 2019 Mortality Multiple Cause-of-Death Files.
Each variable in the LA Mortality File has a corresponding entry in the documentation file. For example, the first variable listed when you preview the data frame should be “restatus”. If you search through the documentation file for “restatus”, you won’t find anything. However, if you search instead for “status”, the first result should be a data item called “resident status”.
Sounds like “resident status” is probably a good fit for our “restatus” variable. The definition for the “resident status” variable is included on the third page of the documentation file.
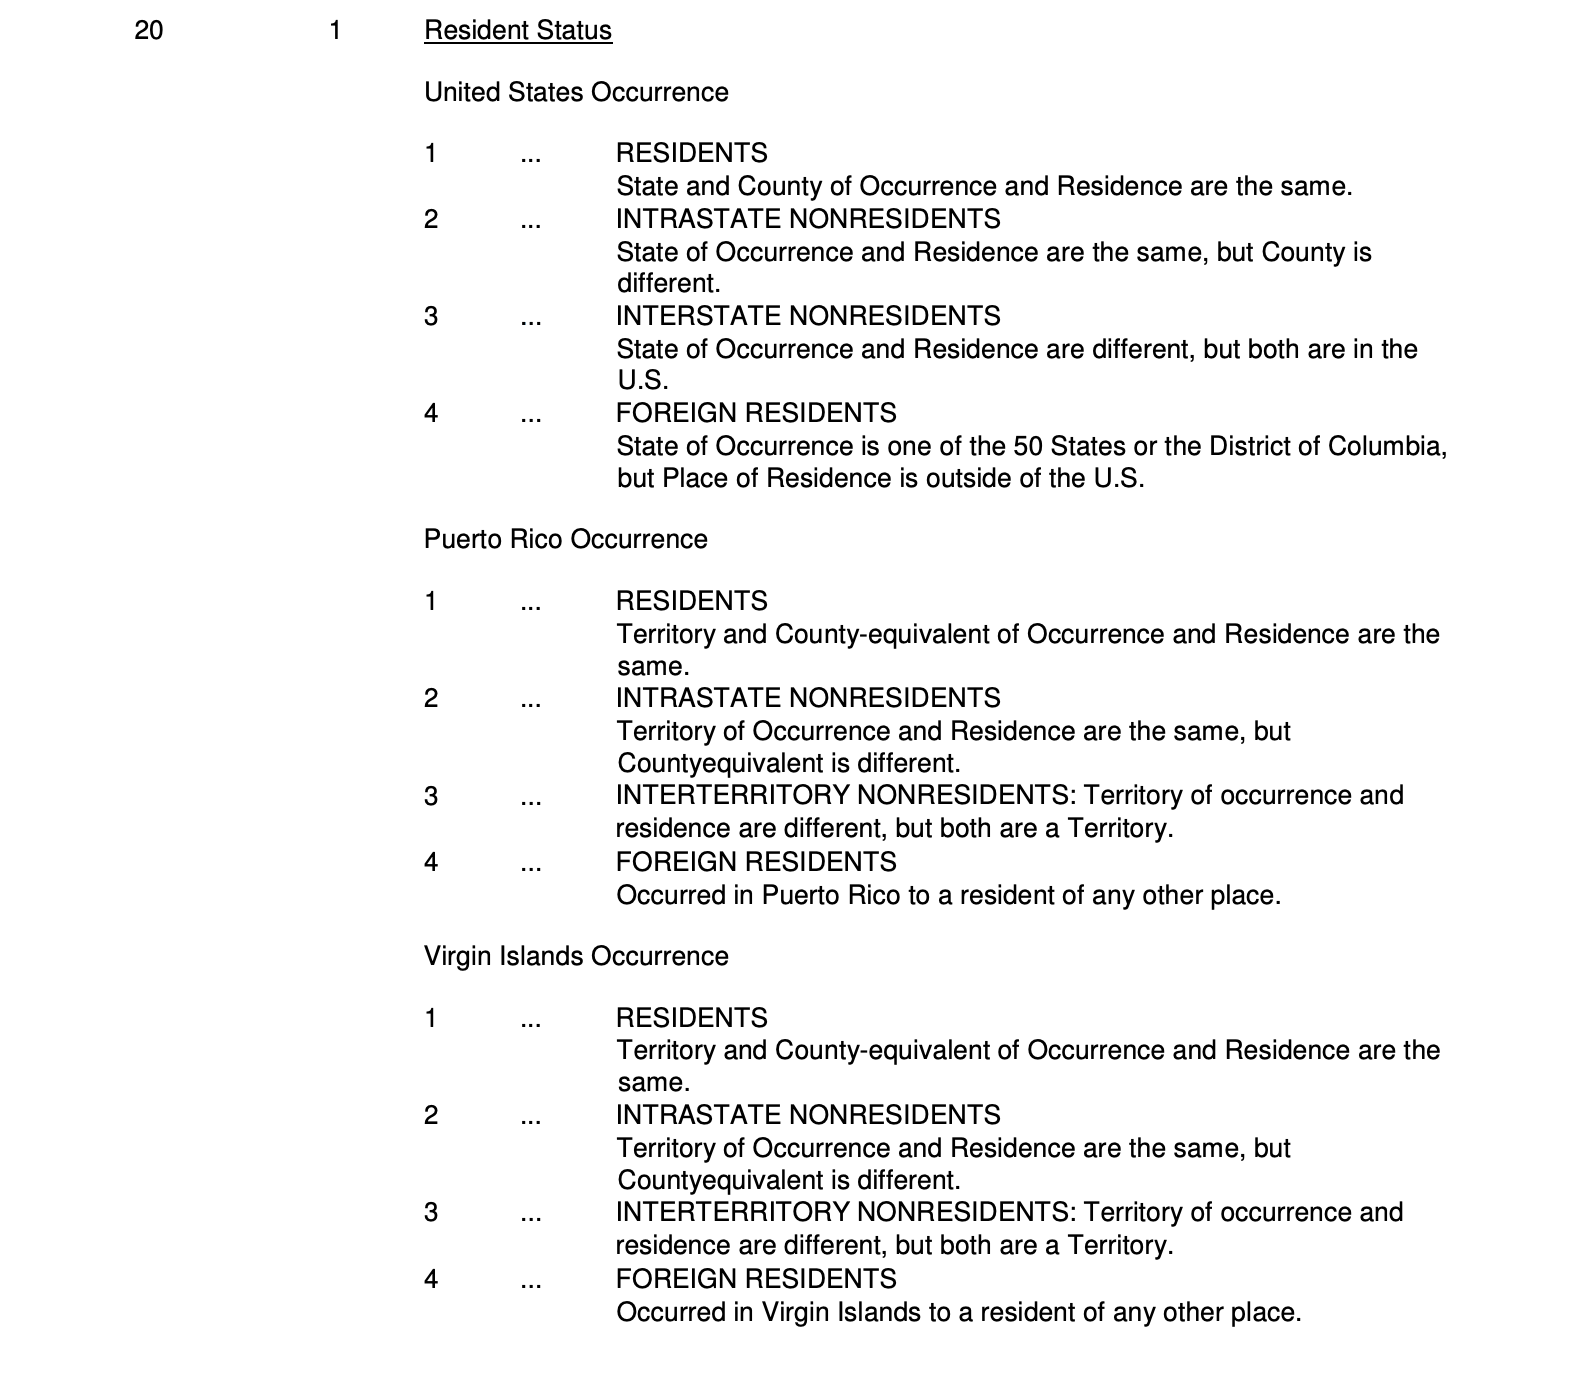
You can see that this variable provides some information on whether the place where a death occurred is also that person’s place of residence (note that we’re only interested in United States Occurence for our purposes). So, on your Markdown document, begin your data element list as follows:
- restatus, Resident Status
- State and county of Occurrence and Residence are the same.
- State of Occurrence and Residence are the same, but County is different.
- State of Occurrence and Residence are different, but both are in the U.S.
- State of Occurrence is one of the 50 States or D.C., but Place of Residence is outside the U.S.
Hint: to italicize a word in a Markdown document write it like this: *restatus*
Continue to build your data element list by adding each variable in the data set and its corresponding definition from the documentation file. Note that for some variables, the descriptions and code values will be lengthy, so you’ll have to abbreviate.
Once you’re finished, save the Markdown document as Cancer Alley Data Description, push it to your hpam7660_Cancer_Alley repo, invite me to the repo, and you’re done!